DarkMoon research series·B. Data visualization & UX·Article 11 of 23·All 23 articles
Introduction
A penetration-testing campaign produces a lot of material at once: dozens of findings, the evidence behind each one, a set of assets, candidate attack paths of very different certainty, a treatment plan, and a mapping to frameworks such as ISO/IEC 27001 or NIS2. The first version of the DarkMoon Pro dashboard tried to show most of it on the first screen. This article describes how we moved to a layered presentation, where each view answers one main question and the rest is one action away.
Everything below comes from the public research record darkmoon-visualization-research. Each figure carries the status label used there: VERIFIED (checked in a primary artefact such as a commit, code or a build log), OBSERVED (stated in a report, not re-checked), SIMULATED (synthetic data or harness).
Problem
Two different readers open the same campaign:
- an operator, who needs findings, evidence, the infrastructure map and the paths;
- a decision-maker, who needs a rating, the first actions to fund and the regulatory relevance.
Putting both on one screen produced two kinds of defect that the record treats as bugs, not as matters of taste:
- Contradictory figures for one notion. Two examples are recorded: a PDF that said « 0 proven » in one place and « 5 proven » in another (a regex bug), and a tile announcing « 7 fixes tied » next to a plan with many more actions (OBSERVED, owner sessions; fixed).
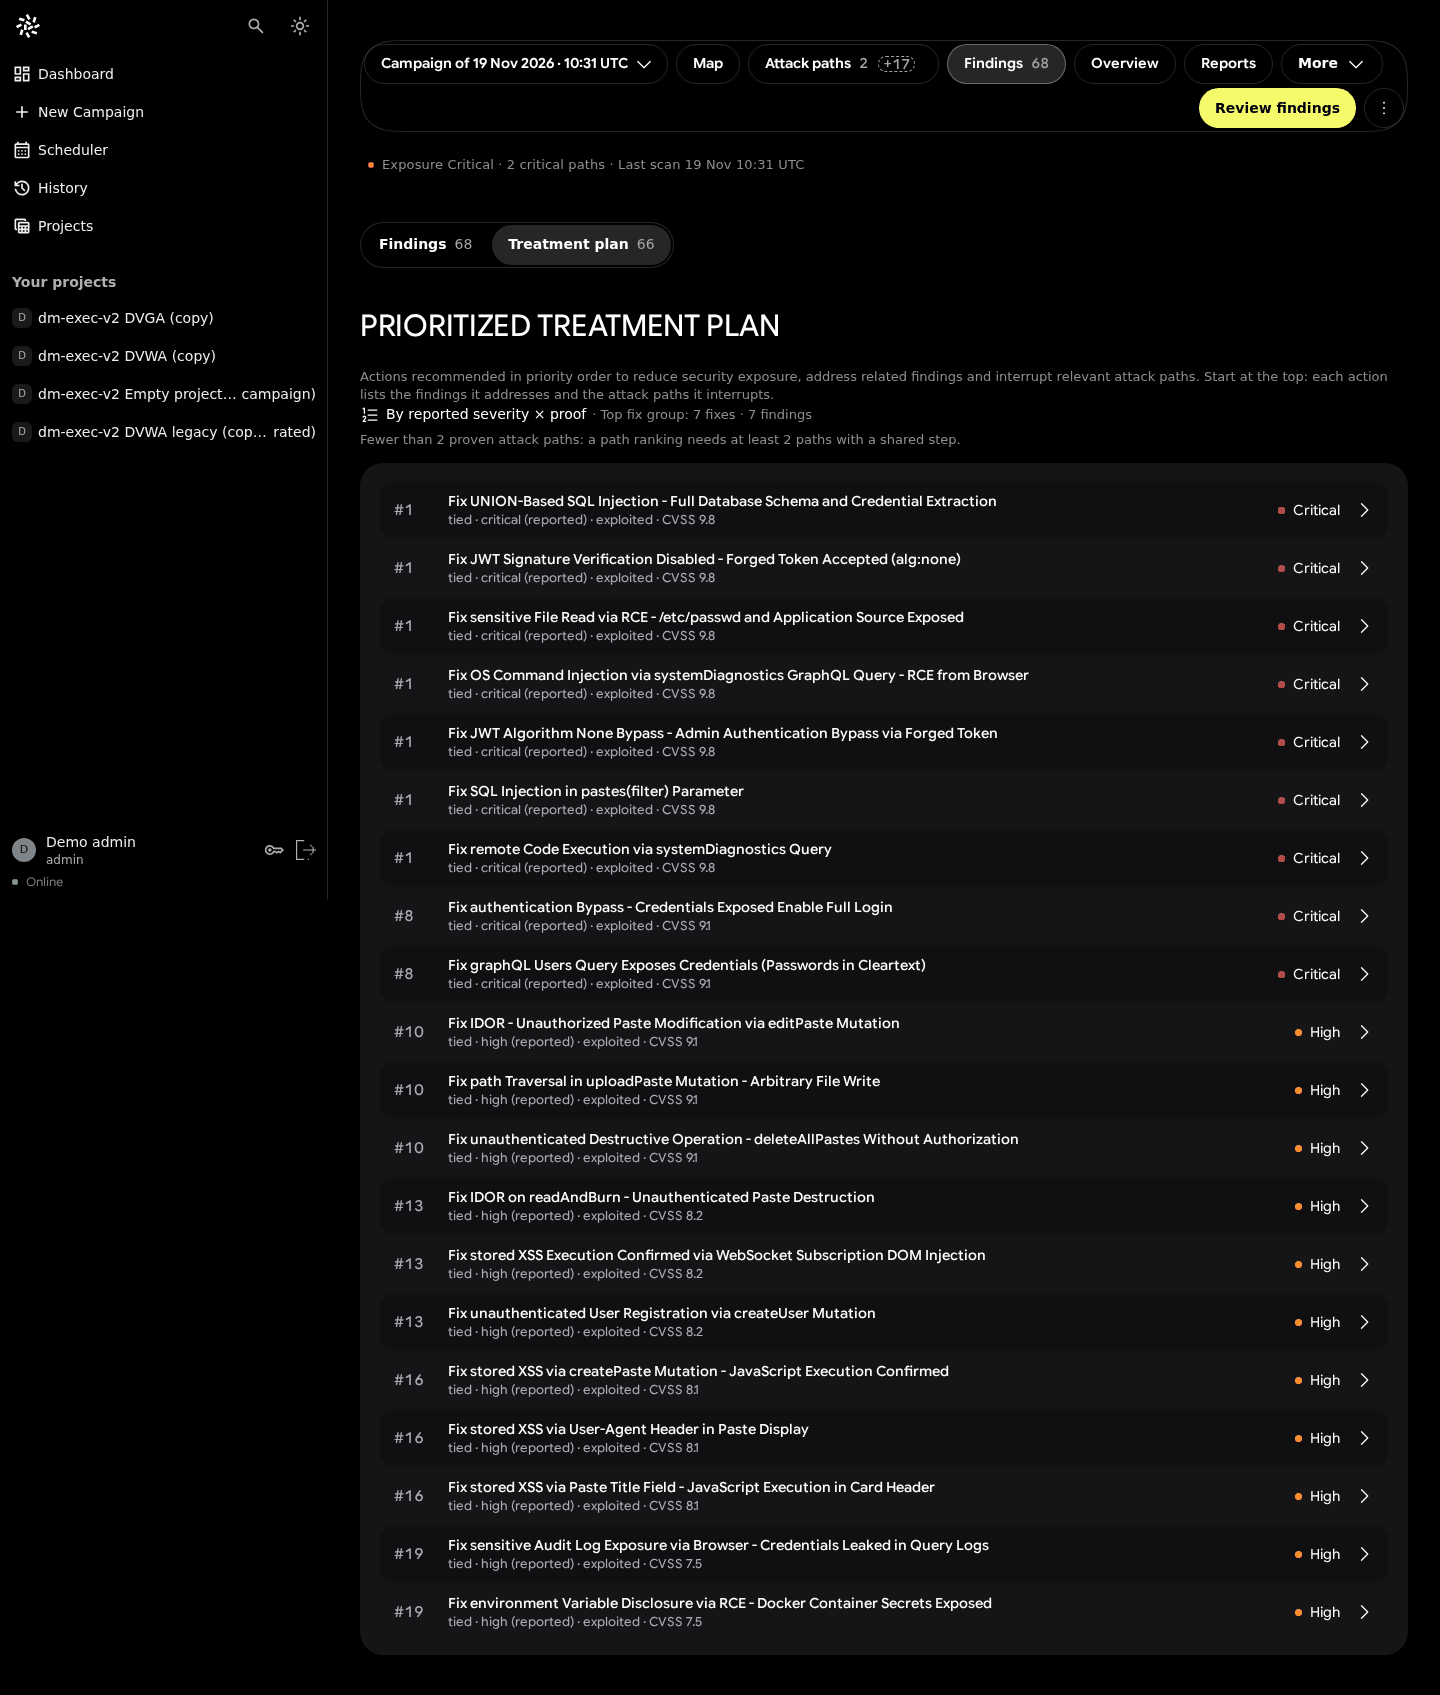
- Volume without order. The treatment plan listed one fix per finding: 66 per-finding « fixes » on the demo campaign (VERIFIED, capture v1).
The rule that came out of the owner reviews was short: one main question per view, details on demand (OBSERVED, owner notes, 2026-10-30).
Methodology
We did not invent a method. Progressive disclosure is an established interaction pattern: show the frequently needed options first and defer the rest to a secondary level (Nielsen, 2006). It descends from Shneiderman's information-seeking mantra, « overview first, zoom and filter, then details on demand » (Shneiderman, 1996), and from focus+context work on degree of interest (Furnas, 1986).
What was specific to DarkMoon was the way decisions were made and checked:
| Practice | What it means here | Status |
|---|---|---|
| Owner review rounds | The product owner reviewed captures of every screen and answered with short verdicts | OBSERVED |
| AI adversarial critics | Capture-based critique rounds; their scores are not usability measures | OBSERVED |
| Real captures on demo data | Fixed viewports from 1440×900 down to 320×640, light and dark themes | VERIFIED (capture logs) |
| Server computes, UI displays | Every number on a view comes from a server document; the client never recomputes a score or a ranking | VERIFIED (report and parity test names) |
The last rule matters for progressive disclosure: hiding a detail is only safe if the summary above it is computed from the same source as the detail below it.
Real results
The executive block: grade, one sentence, then the reasons
The campaign overview now opens on a single block. It shows a grade letter and a score out of 100, or the words « Not rated » (never an empty number). Next to it are one coverage sentence and a short « what holds the grade » paragraph. The first three actions follow. The regulatory relevance is a single collapsed line, and « Why this rating » is a fold (VERIFIED, capture v9; OBSERVED, internal report on Executive Security V2).
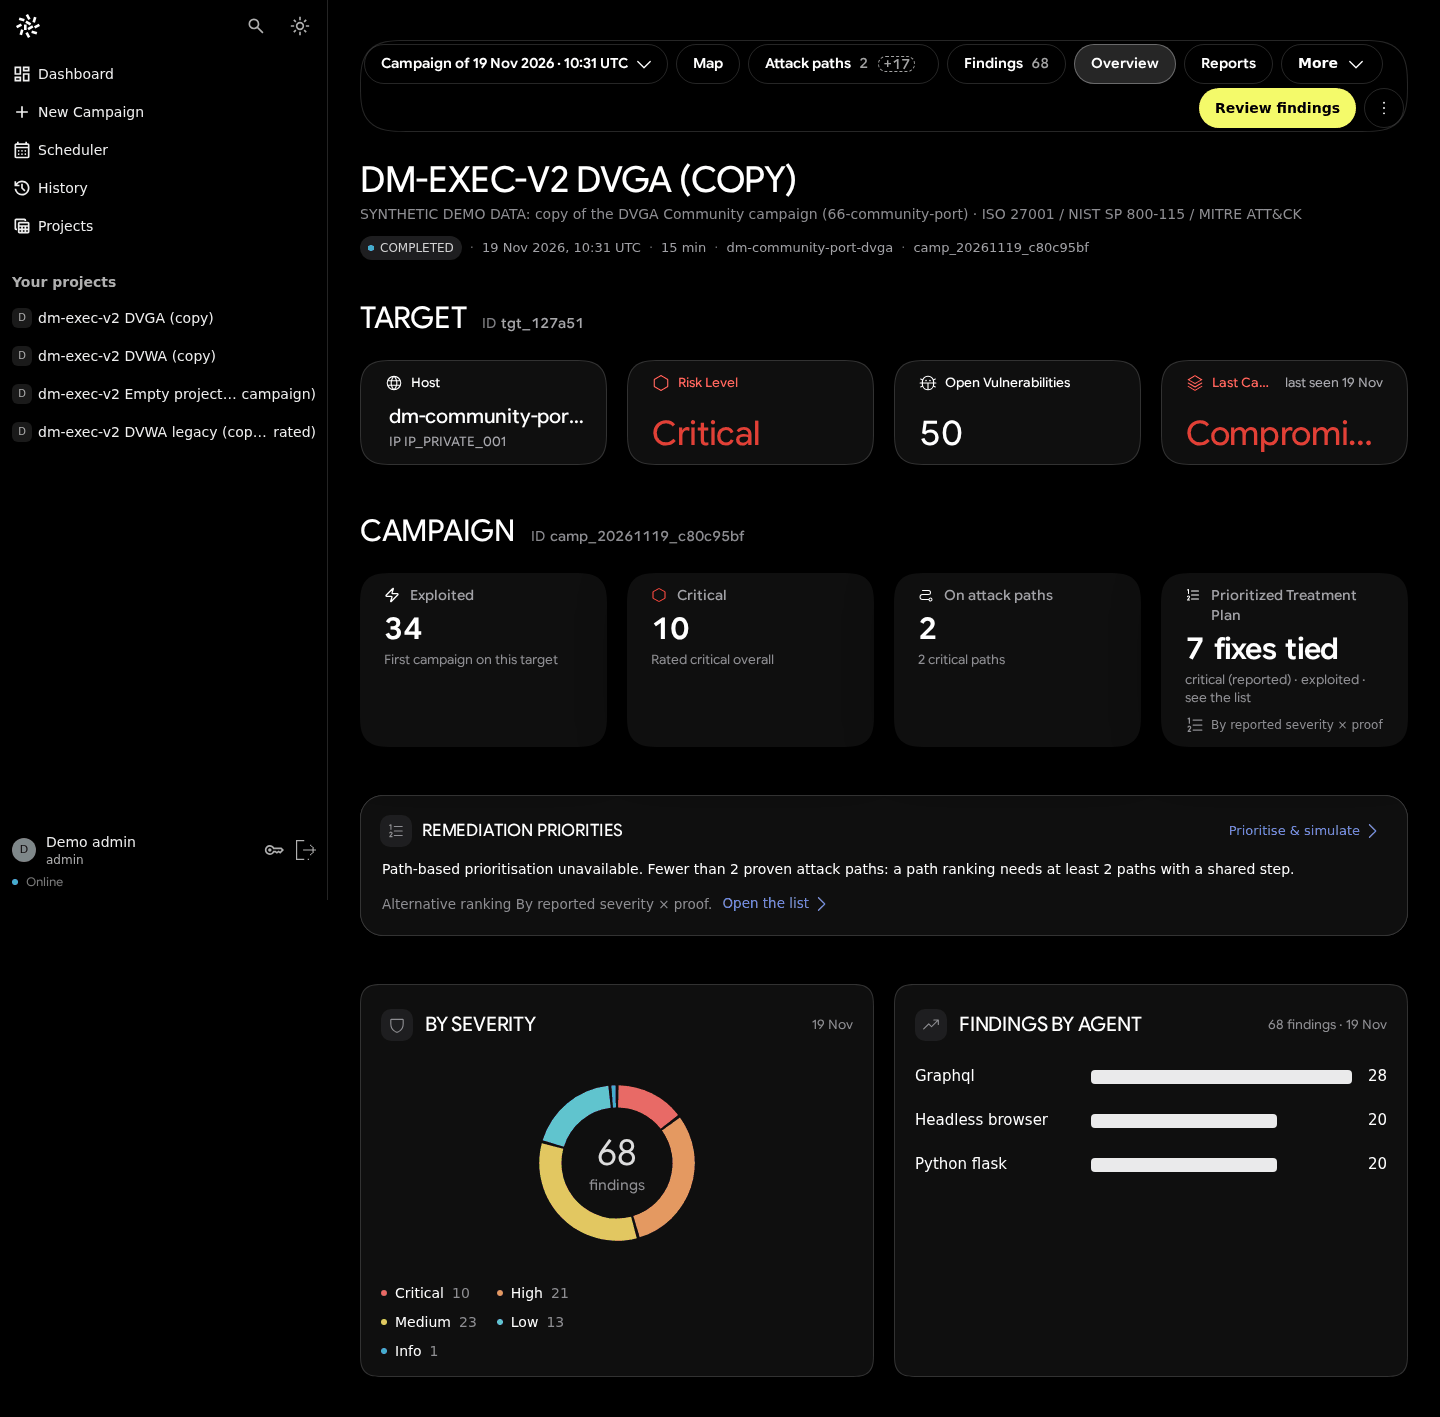
Before (v1): the campaign overview prior to Executive Security V2. Real UI, synthetic demo data from an earlier seed.

After (v9): one block answers « how exposed is this scope, and what do we do first? ». Real UI, synthetic demo data.
A caution on reading the pair: v1 used an earlier demo seed, so part of the visual difference is a data difference (stated in the repository limitations).
The treatment plan: from 66 rows to 14 actions
The plan changed its unit. Instead of one fix per finding, it now groups work by asset × weakness class: one SQL-injection action on one target covers every SQL-injection finding on that target. On the demo campaign, 66 per-finding fixes became 14 actions (VERIFIED, before/after captures). The view then shows the first 10 actions and a « Show all » control, and the explanation of how the plan is built sits behind a fold (OBSERVED, internal report).
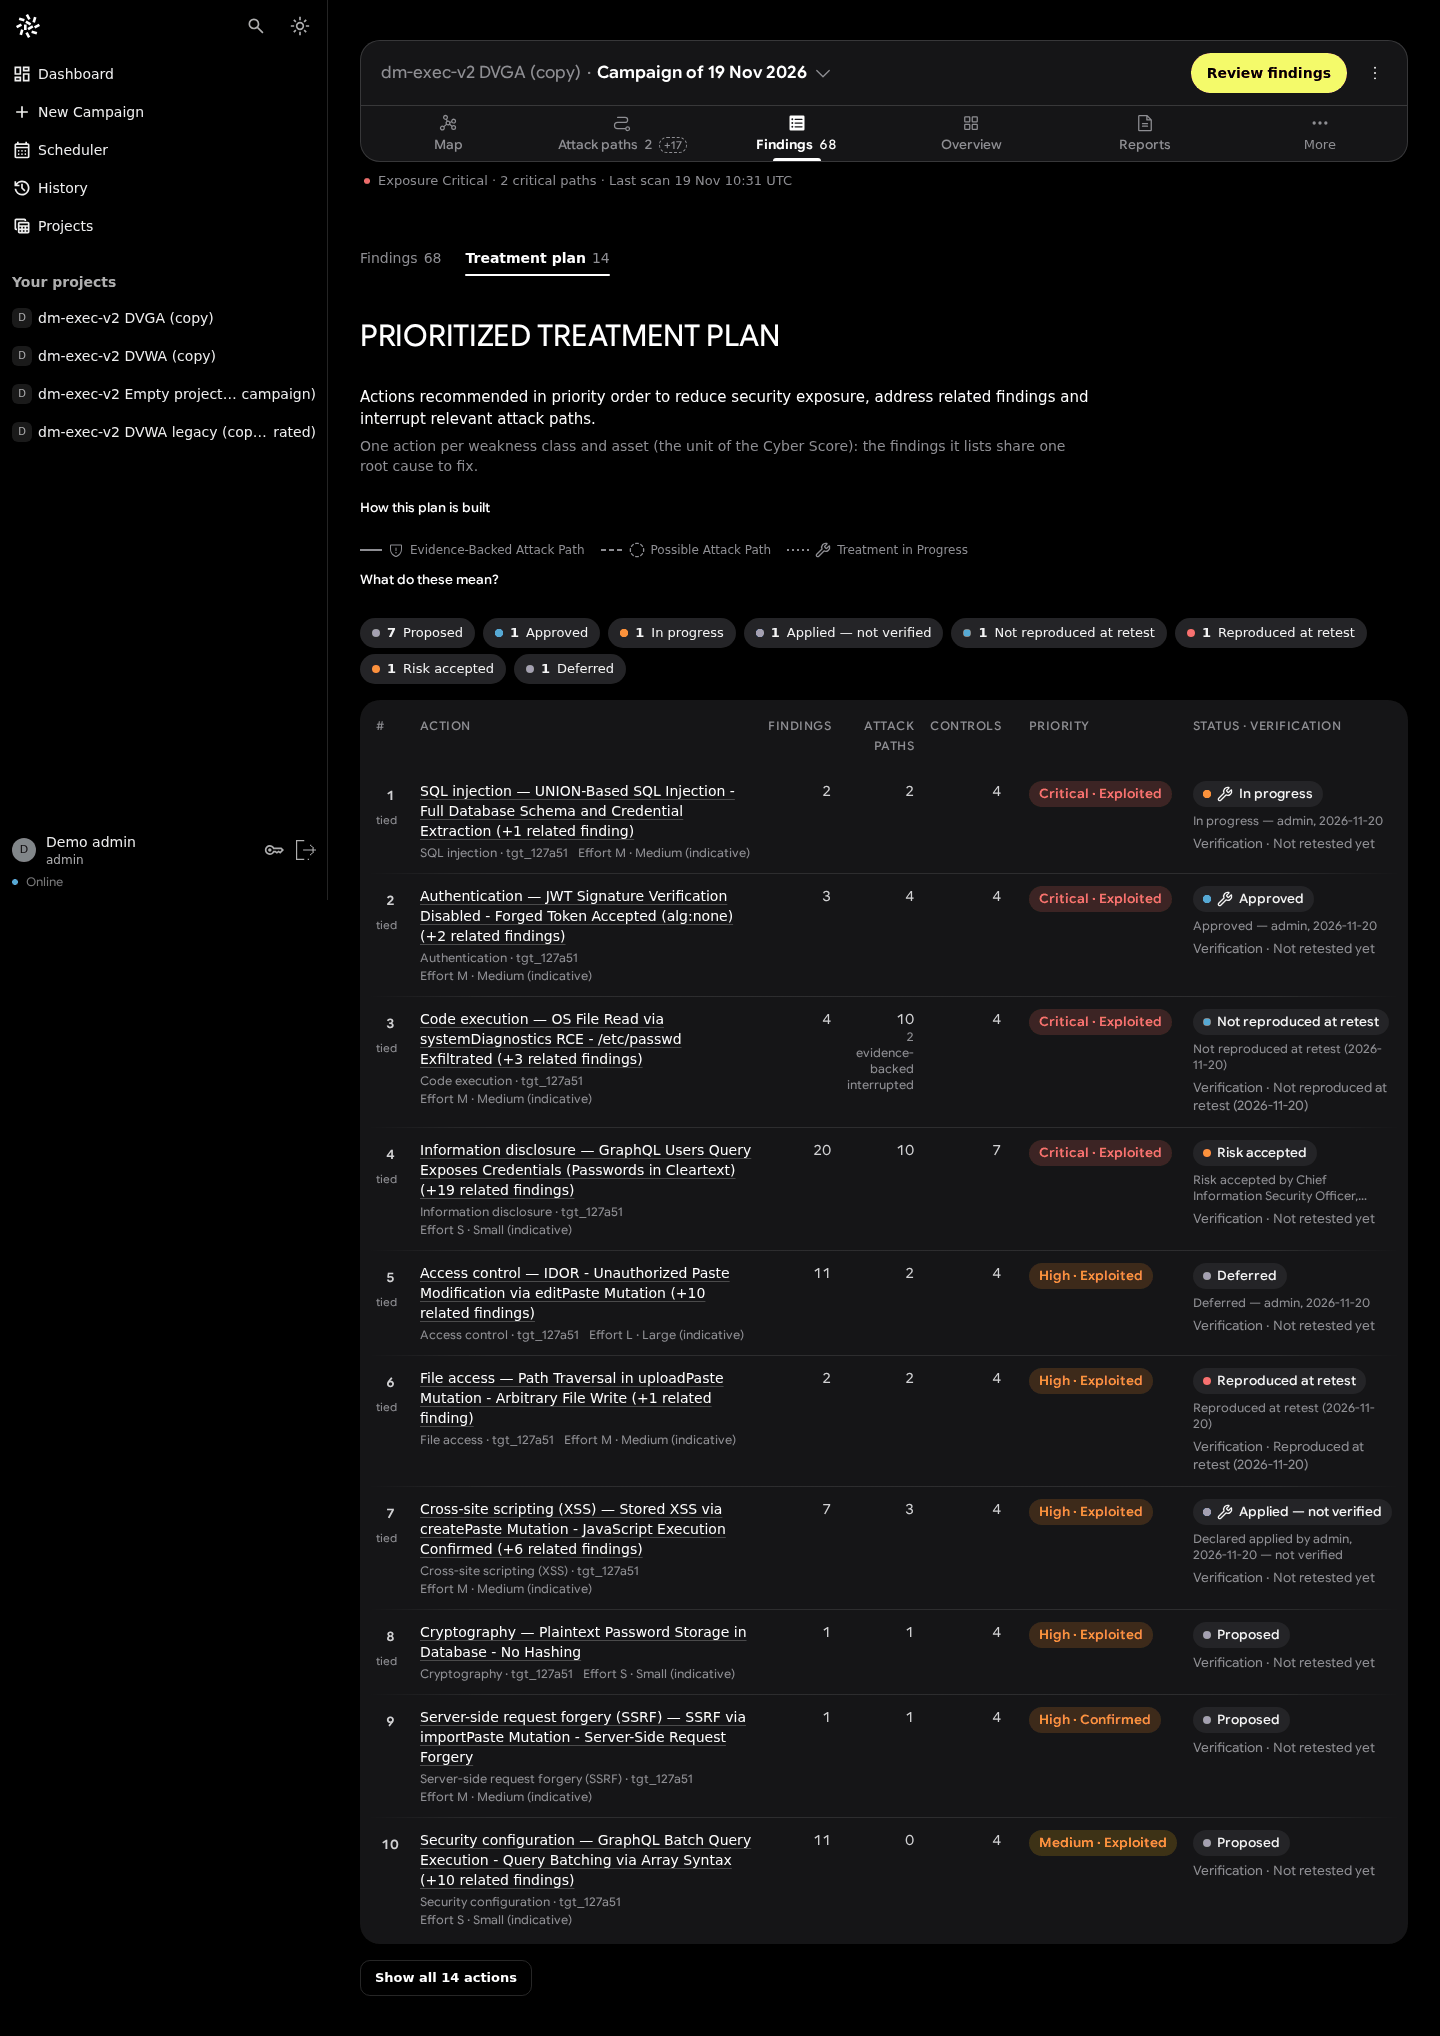
The legend behind a question
Proof vocabulary (Evidence-Backed, Possible, Treatment in progress) is needed to read the maps, but not on every glance. It now sits behind « What do these mean? » in the web UI and behind the L key in the terminal (OBSERVED for the web wording; VERIFIED for the terminal key binding in code).
Phones: no view hidden behind a sideways scroll
On a 390 px phone, the old campaign bar hid some views behind horizontal scrolling. The current header shows five equal cells (Map, Paths, Findings, Overview, More), with counters as badges, and Reports moved into « More » (VERIFIED, captures v6 → v7). This is disclosure by priority, not by hiding: every view stays reachable in one tap.
The terminal follows the same order
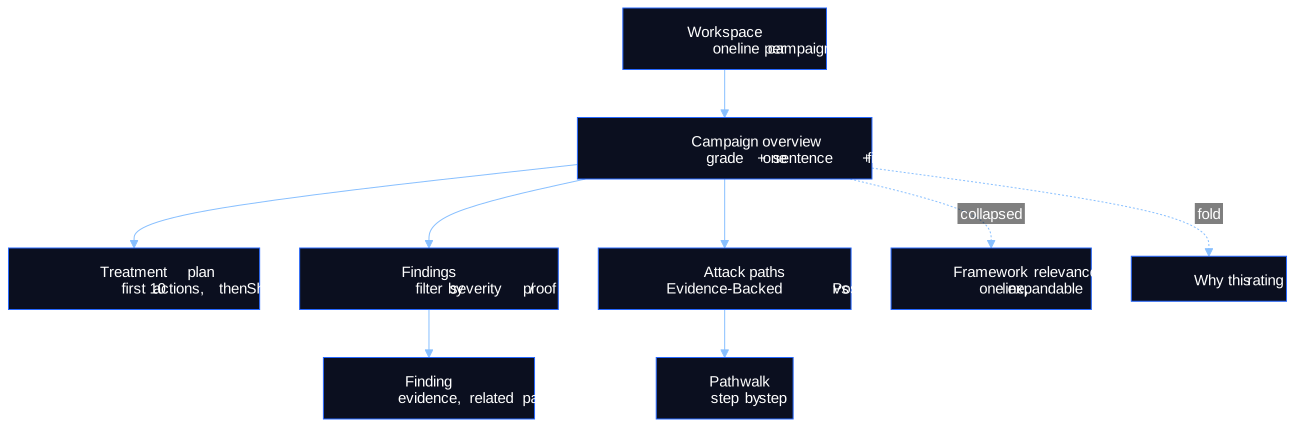
The Terminal Explorer applies the same layering in 80 columns: workspace → projects → campaign → findings → finding → evidence, with the report's chapters behind a contents toggle (VERIFIED, code).
Limits
- No user study. No task-time, error-rate, SUS or comprehension data exist. We cannot say that layered views help operators decide faster; we can only say the contradictions were removed and the owner accepted the result. This is not measured.
- Single design authority. Decisions reflect one product owner plus AI critics, not a panel of users; owner quotes in the record are translated from French.
- Demo data only. All captures use one synthetic demo dataset built from lab campaigns against deliberately vulnerable applications (DVGA, DVWA).
- Performance is not part of this claim. The production initial bundle is 1.23–1.26 MB raw in three build logs (VERIFIED). No Lighthouse run exists for the Angular client (not measured).
- Rules move. « Never add a card » (29 October) became « you may add cards if they are well made, no duplicates or filler » (20 November). Progressive disclosure here is a working rule, not a finished theory.
Figures
- Figure 1 (Mermaid, above): disclosure levels.
- Before/after captures: README gallery of the research repository, each image with a
metadata.json(commit, viewport, theme, data source).
Scientific sources (verified)
- B. Shneiderman. « The eyes have it: a task by data type taxonomy for information visualizations ». Proceedings 1996 IEEE Symposium on Visual Languages, 1996. doi:10.1109/VL.1996.545307
- J. Nielsen. « Progressive Disclosure ». Nielsen Norman Group, 2006. https://www.nngroup.com/articles/progressive-disclosure/
- G. W. Furnas. « Generalized fisheye views ». CHI '86, ACM SIGCHI Bulletin 17(4), 1986. doi:10.1145/22339.22342
- T. Munzner. Visualization Analysis and Design. A K Peters / CRC Press, 2014. doi:10.1201/b17511
- W3C. Understanding SC 1.4.10: Reflow (WCAG 2.2). https://www.w3.org/WAI/WCAG22/Understanding/reflow.html
DOIs were checked against Crossref and URLs fetched on 2026-11-20.
Research, source code & reproducibility
- Main research repository: ASCIT31/darkmoon-visualization-research. See research/human-computer-interaction, decisions (UXDR-04, UXDR-14, UXDR-16) and benchmarks for the list of what is and is not measured.
- Source code: ASCIT31/Dark-Moon (DarkMoon Community). The terminal views discussed here are in
conf/plugins/darkmoon-explorer. The Pro Angular client is proprietary; its commits are cited in the research repository by short hash only. - Documentation: https://docs.dark-moon.org
- References: references/README.md, with the verification status of each entry.
- Reproducible experiments: the captures can be compared directly from the repository (
screenshots/historical/vsscreenshots/current/, versions defined inscreenshots/README.md). The terminal side can be reproduced by installing DarkMoon Community, running a campaign on a lab you are authorised to test, and opening/explorein the console.
Related reading: Redesigning a Cybersecurity Dashboard Around Attack Paths · Designing Explainable Security Graphs Without Misrepresenting Evidence · Our UI Experiments: What Worked, What Failed and Why · From Angular to TUI: Designing Two Interfaces Around the Same Security Data
If you design security dashboards and have run a user study on layered views, we would like to compare notes: open an issue on the research repository.
See the proof, not just the write-up: the Pro remediation benchmark (fixes retested against the exploit) · how Darkmoon compares to other AI pentest tools.
← All articles