DarkMoon research series·B. Data visualization & UX·Article 9 of 23·All 23 articles
Introduction
A pentest dashboard used to have an easy job: count findings by severity, list them, link to evidence. Once a product also shows attack paths, and those paths range from "the server recorded this" to "an agent believes this", the dashboard's job changes. It must show exposure without overstating it.
Between March and November 2026, the DarkMoon Pro Angular client went through a long, heavily iterated redesign around that problem. This article summarises what was learned. The full record, including the many rejected directions, is in the visualization research repository; the path semantics come from the sister attack-paths research repository.
The problem
The redesign had four stated goals:
- Show exposure without overstating it. Never present a declared or inferred path as proven; never show two contradictory figures for one notion on one screen.
- Serve two readers with one data model. Operators need evidence, the map and the paths; executives need a rating, a treatment plan and framework relevance.
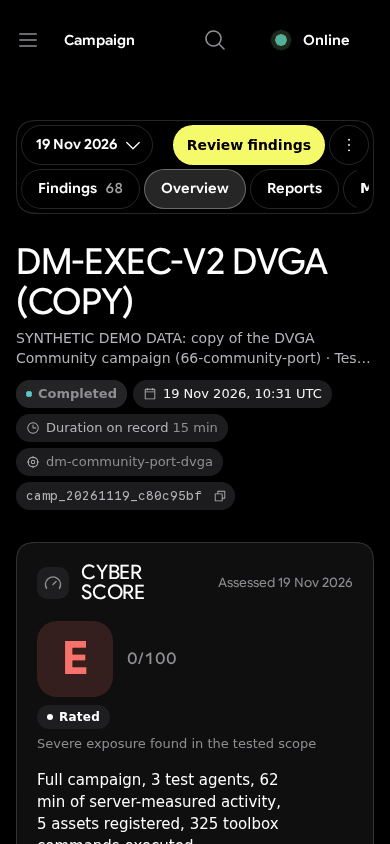
- Work everywhere the operator works: desktop, tablet, phone with no sideways scroll at 320 px, a VR headset browser for the 3D map, and an 80-column terminal.
- Stay inside the brand and an accessible baseline: state never encoded by colour alone, 44 px touch targets, keyboard paths, light and dark themes.
The first goal turned out to dominate the others.
Methodology
- Real captures on synthetic demo data at fixed viewports (1440×900, 834×1112, 390×844, 320×640, light and dark), versioned v1 to v9, each folder with a
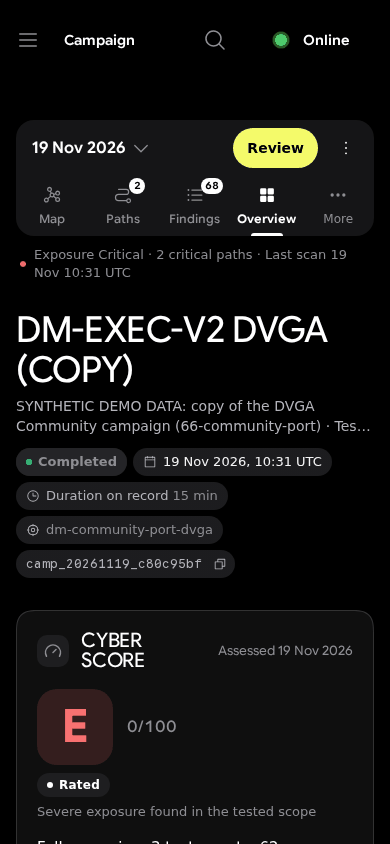
metadata.json. The demo data are renamed copies of lab campaigns against deliberately vulnerable applications, labelled "SYNTHETIC DEMO DATA", with IP addresses tokenised. - Owner reviews and AI adversarial critics, including a structured adversarial UI review on 16 November that found ten issues ranked BLOCKER to LOW.
- Measured reproduction of the chosen design kit: computed-style comparison between the kit and the app until zero deviation, then per-component pixel diffs.
- A ranked design study for one component (the campaign bar): 20 mock-up boards scored against recorded complaints.
- Only measures found in build logs, test logs, commit bodies, reports or code are reported as benchmarks. There is no user study.
Real results
1. Fix the data before the renderer
The first infrastructure map looked incoherent. An audit showed the cause was data, not styling: findings were attached to nodes client-side by host matching, and on one production campaign 38 of 40 findings had no node id, so they piled on the root. No renderer could fix that. The fix was server-side deterministic attachment (a lab test attached 57 of 57 findings, OBSERVED). The breadth-first "attack paths" introduced at the same time were later renamed exposure paths.
2. Contradictions are defects
The decisive constraints were epistemic. Examples treated as bugs, not as copywriting:
- the PDF summary tile said "0 proven" while a later section said "5 proven" (a regex scraping the annex; fixed);
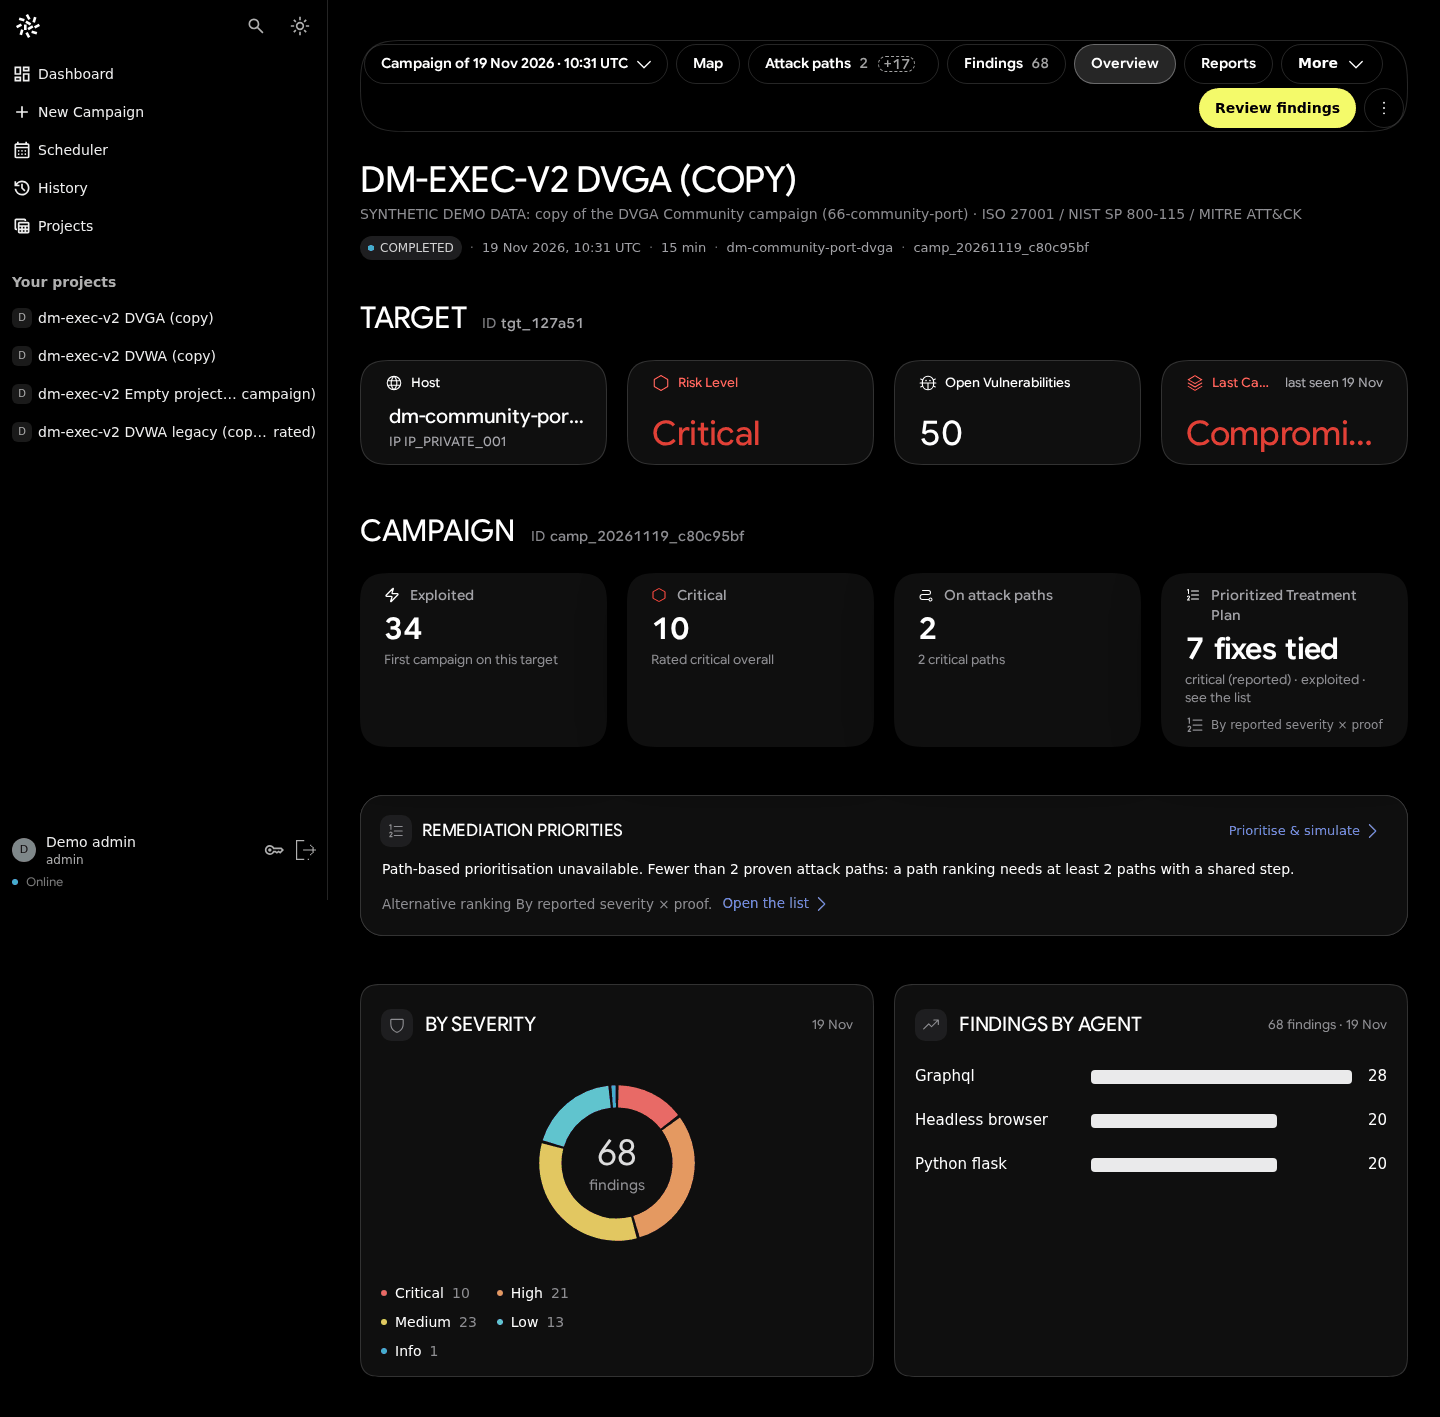
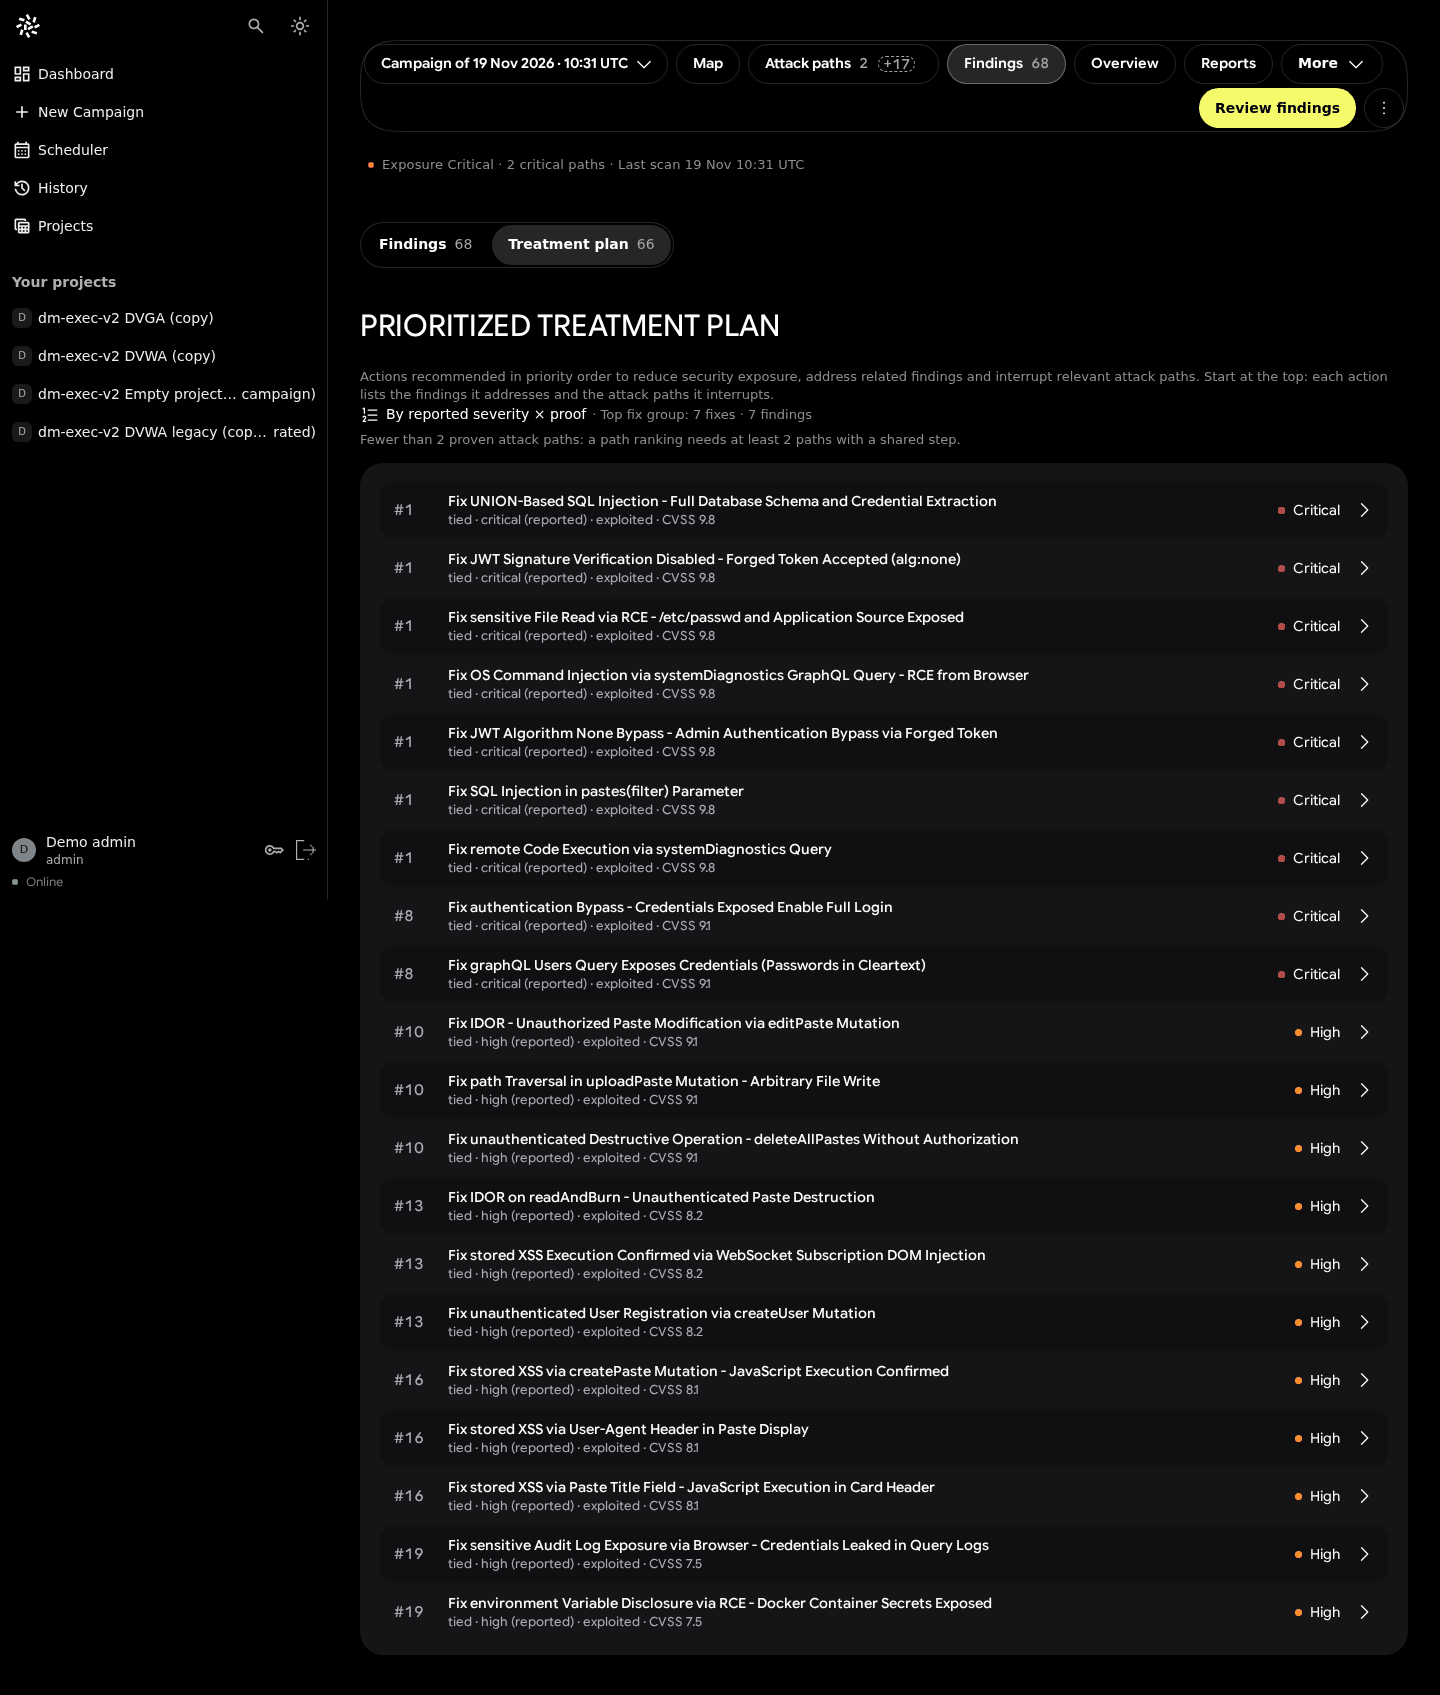
- a "7 fixes tied" tile coexisted with 67 actions;
- a campaign that exited without finishing was announced "Campaign completed" (found by the adversarial review).
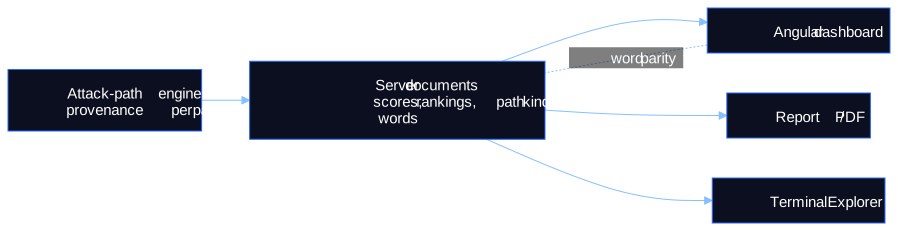
The rule that came out of it, the server computes, the UI displays, means every number on a view comes from a server document; the client never recomputes a score, a ranking or a path, and word parity between server and front end is tested.
3. Honest path labels everywhere
Server provenance (observed, derived, declared, inferred, agent-declared) is collapsed into two visual classes: Evidence-Backed (solid line and shield) and Possible (dashed line and dashed circle). Operator-declared paths are a separate class, never counted. Without a proven path, prioritisation by path is refused, and the interface says so: "No ranking by attack path. No Evidence-Backed Attack Path in this campaign: nothing to rank by paths."
4. A plan by weakness, not by finding
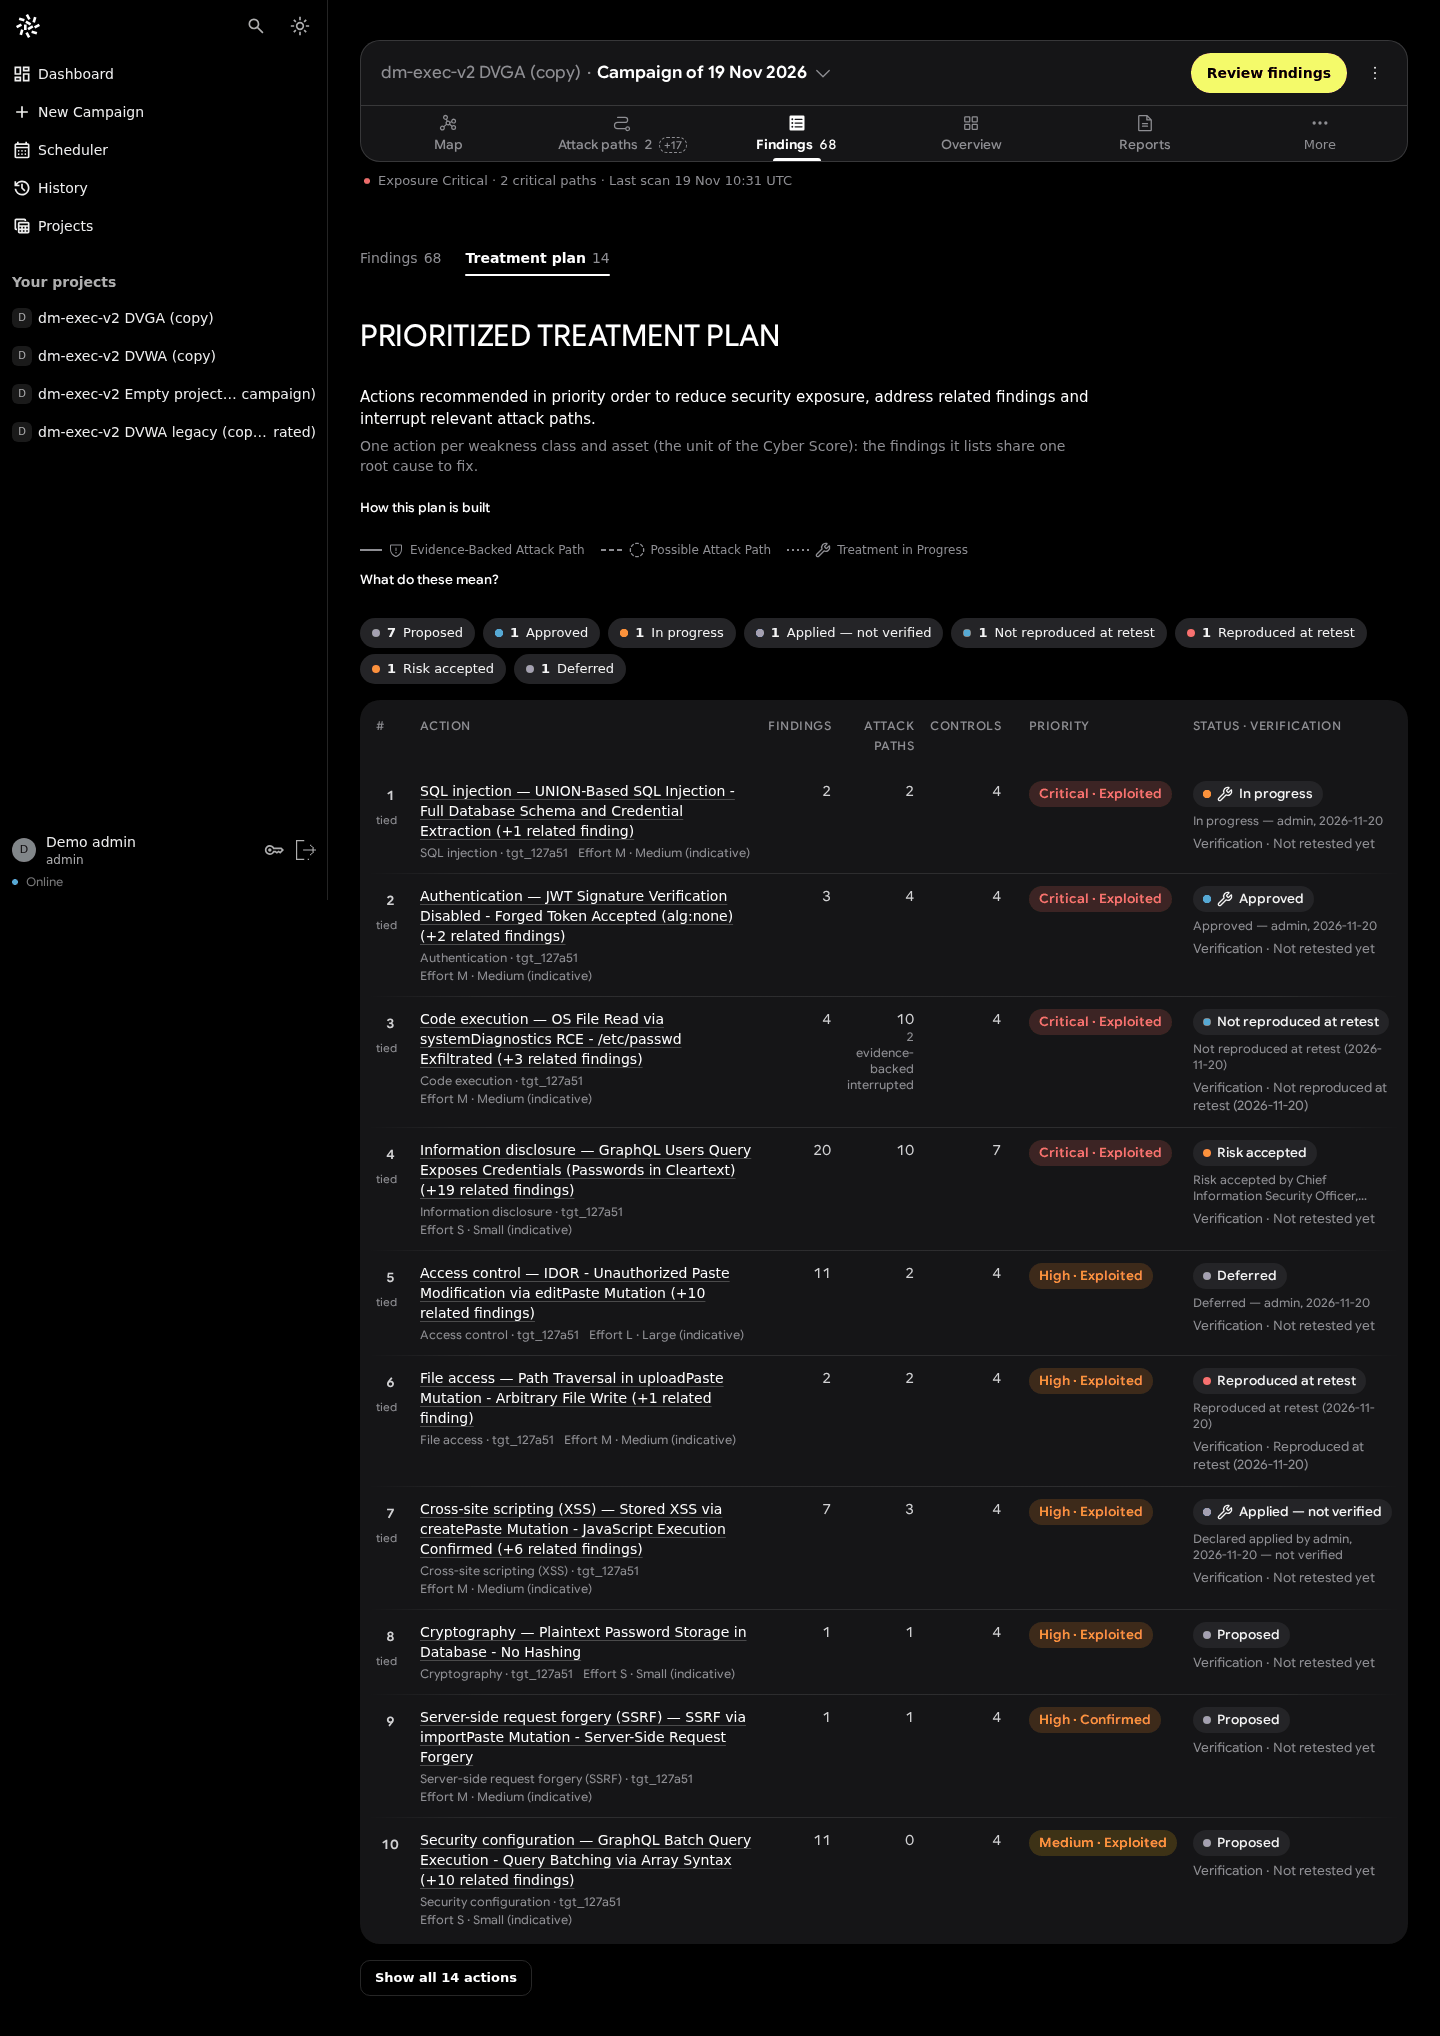
The treatment plan went from 66 per-finding "fixes" to 14 actions, one per asset × weakness class, each with status, verification, attack paths and controls. The campaign tile now reads "14 actions, 4 tied at the top", removing the earlier contradiction.
5. Most visual experiments were rejected
About 70 UI branches and some 120 worktrees were created between late October and mid-November. A full-screen 3D dashboard, a plain-language "brief" layout, fintech-style layers, liquid-glass effects, a pixel-matched node-editor flow graph and about 95 "night hunt" design lots were all rejected or reverted. Invented cards were forbidden for a while ("modernise what exists"); the rule was relaxed on 20 November to "well-made cards, no duplicates or filler". The lesson recorded in the repository is blunt: measured reproduction beat invention.
6. The campaign bar, decided against the study
The 20-board study ranked Board 02 first, Board 01 second and Board 07 third, and rated Board 13 "heavy on desktop". The owner chose Board 13: one header card with equal-width icon-over-label tabs, all views visible on phones without sideways scroll. It was implemented by deleting the old rules from 11 stylesheets rather than out-ranking them, under time pressure, with the post-deploy review not yet recorded.
7. Measures that exist
- Production initial bundle 1.23 to 1.26 MB raw, about 255 to 264 kB transferred (three build logs).
- Dashboard layout shift CLS 0.1065, fixed by reserving heights for asynchronous cards.
- Angular unit tests 718 → 835 → 844.
Limits
- No user study. Whether people understand "Evidence-Backed vs Possible" without training is a hypothesis.
- Single-owner design authority, plus AI critics; owner quotes are translated from French.
- One synthetic demo dataset; v1 used an earlier seed, so v1 → v2 differences are partly data differences.
- Known inconsistency: corroborated
derivedpaths can be counted differently by the legend and the rail (0 on the demo data). - Not measured: Lighthouse on the Angular client, frame rate of the 3D map, layout time, any task-time or comprehension metric.
Figures

Scientific sources
- Shneiderman. The eyes have it: a task by data type taxonomy for information visualizations. IEEE Symposium on Visual Languages, 1996. doi:10.1109/VL.1996.545307
- Munzner. Visualization Analysis and Design. A K Peters / CRC Press, 2014. doi:10.1201/b17511
- Nielsen. Progressive Disclosure. Nielsen Norman Group, 2006. nngroup.com
- W3C. Web Content Accessibility Guidelines (WCAG) 2.2. w3.org
- W3C. Understanding SC 1.4.10: Reflow. w3.org
All entries come from the verified bibliography of the visualization repository.
Research, source code & reproducibility
- Main research repository: ASCIT31/darkmoon-visualization-research, see the UI reform history, the UX decision records and the before/after chronology
- Sister research repository: ASCIT31/darkmoon-attack-paths-research (the evidence model behind the path labels)
- Source code (open source): ASCIT31/Dark-Moon, including the Terminal Explorer. The Pro Angular client is proprietary; the live demo at demo.dark-moon.org shows it.
- Benchmarks: visualization benchmarks (measures that exist and an explicit "not measured" list); ASCIT31/Darkmoon-Benchmarks for detection
- Official documentation: docs.dark-moon.org
- Scientific references: bibliography
- Reproducible experiments: successes, failures and reverts, campaign-bar study, screenshots with metadata
Related articles
- Visualizing Cyber Attack Paths: From Node-Link Diagrams to Orbital Graphs
- Declared vs Proven Attack Paths: A Practical Evidence Model
- From Vulnerability Findings to Attack Paths: DarkMoon's Research Journey
- Why Our First Attack-Path Architectures Failed
- Progressive Disclosure in Vulnerability Management Interfaces
- Our UI Experiments: What Worked, What Failed and Why
The most useful thing we do not have yet is a user study of the proof labels. If you run security operations and would test "Evidence-Backed vs Possible" with your team, the visualization repository is where we would like to hear about it.
See the proof, not just the write-up: the Pro remediation benchmark (fixes retested against the exploit) · how Darkmoon compares to other AI pentest tools.
← All articles