DarkMoon research series·B. Data visualization & UX·Article 10 of 23·All 23 articles
Introduction
Attack paths are graphs, and graphs are notoriously easy to draw badly. A security graph adds a second difficulty: the edges do not all carry the same certainty, and the drawing must not make a hypothesis look like a fact.
DarkMoon ended up with several coexisting views of the same campaign graph, from a classic node-link tree to a three.js orbital map that opens in a VR headset browser, and a text rendering for the terminal. This article compares them, explains the shared encoding of proof level, and is explicit about what has not been measured. Sources are the graph-layouts research and the orbital graph study in the visualization research repository.
The problem
The research question for the orbital map states the constraints well. Show a campaign's infrastructure, findings and attack paths so that:
- an operator can locate exposure at a glance;
- a path is never shown as more certain than the evidence allows;
- the same view works on PC, tablet and a VR headset browser;
- it stays within the product's visual charter.
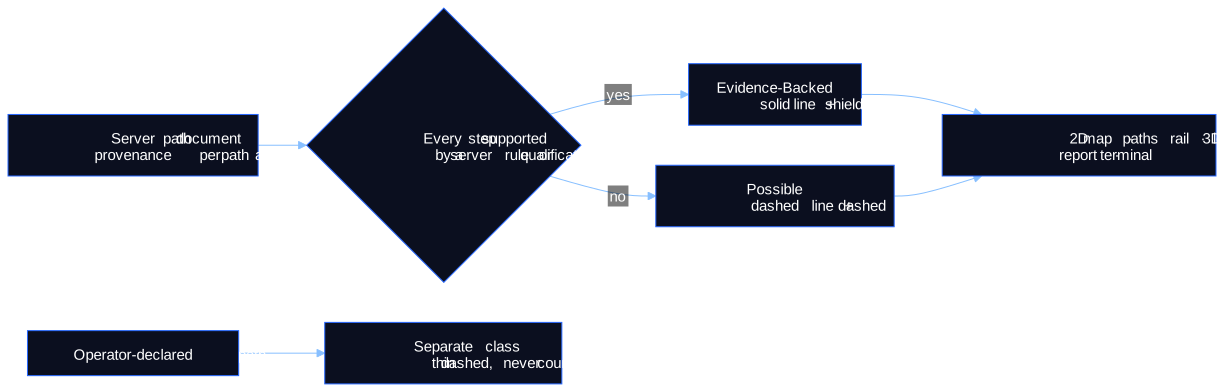
Point 2 depends on the engine. DarkMoon's paths are labelled by their weakest link: Evidence-Backed only when every step is supported by a server rule or qualification, Possible otherwise (see the evidence model). On real campaigns most paths are Possible, so the visualisation must make "possible" readable and calm, not alarming and not invisible.
Methodology
The repository records each layout family from code at a documented commit, with the decision that introduced it and its known weaknesses. Captures are real UI screenshots on synthetic demo data; mock-ups are labelled as such. Measures are reported only when found in a primary artefact; otherwise the repository writes UNKNOWN.
The layout families
| Family | Implementation | Reading direction | Strength | Weakness / status |
|---|---|---|---|---|
| Hierarchical tree | AntV G6 v5 with dagre, top-down | root → leaves | familiar | with incoherent data, disconnected islands and every finding on the root; legacy |
| Layered path graph | ELK Layered, vendored, loaded on demand | entry left → critical asset right | deterministic; proven solid, hypothesis dashed; choke points double-ringed (×N paths) | layout cost on phones was a decision topic |
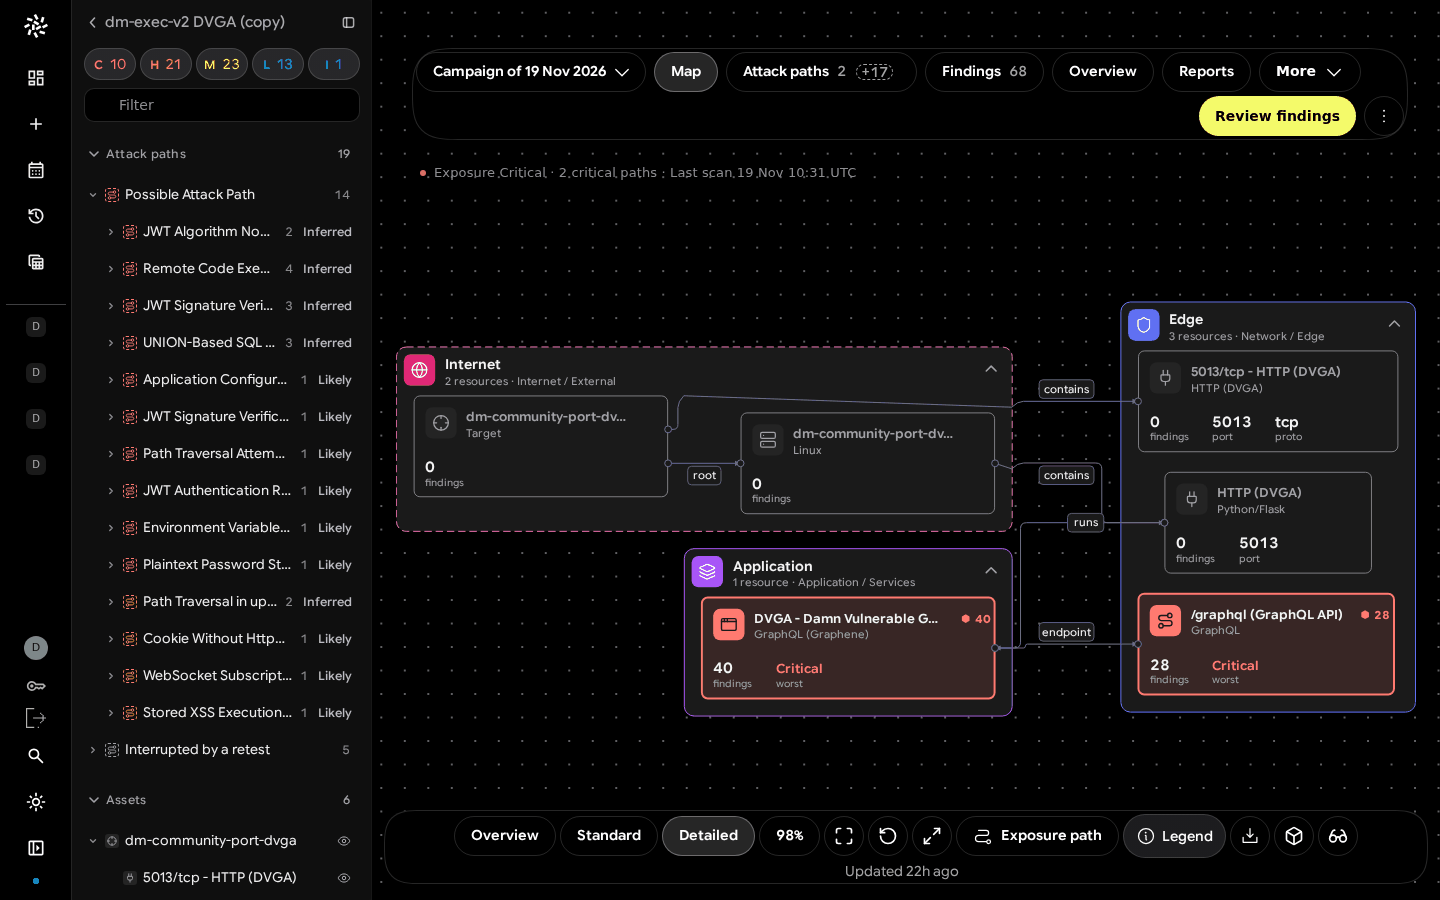
| Atlas 2D map | custom canvas, nested boundaries (Internet / Edge / Application / Data) | zones by exposure | whole-page map, semantic zoom with a 12 px label level of detail, fit-to-chain | ancestor never merged; reimplemented |
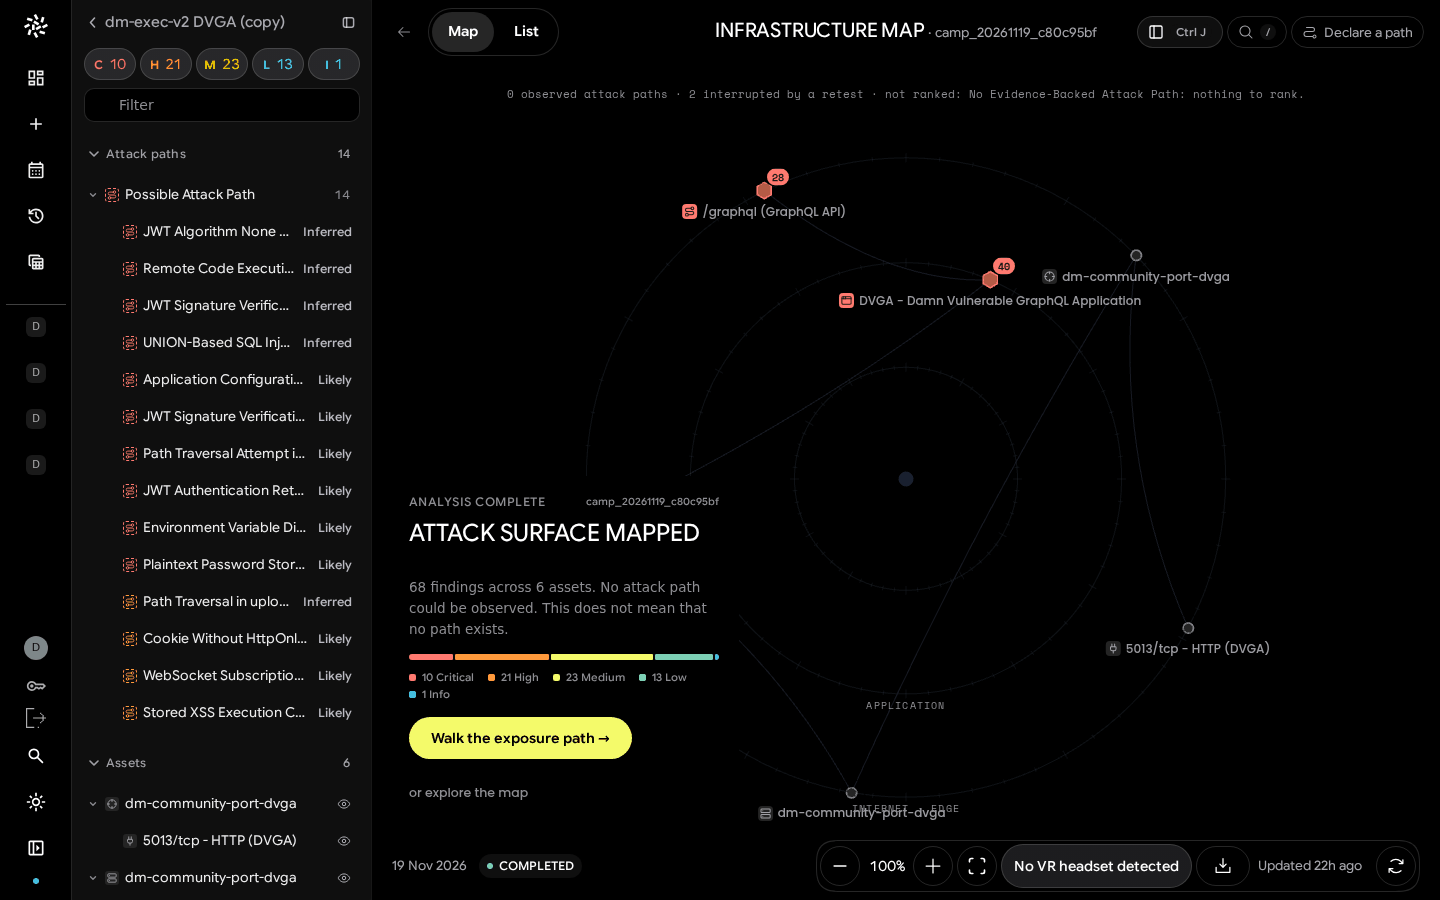
| Orbital 3D map | three.js + WebXR, render on demand | rings = server exposure zone | PC, tablet, headset; guided story only for a proven path | severity colours differ from app tokens; no frame-rate measure |
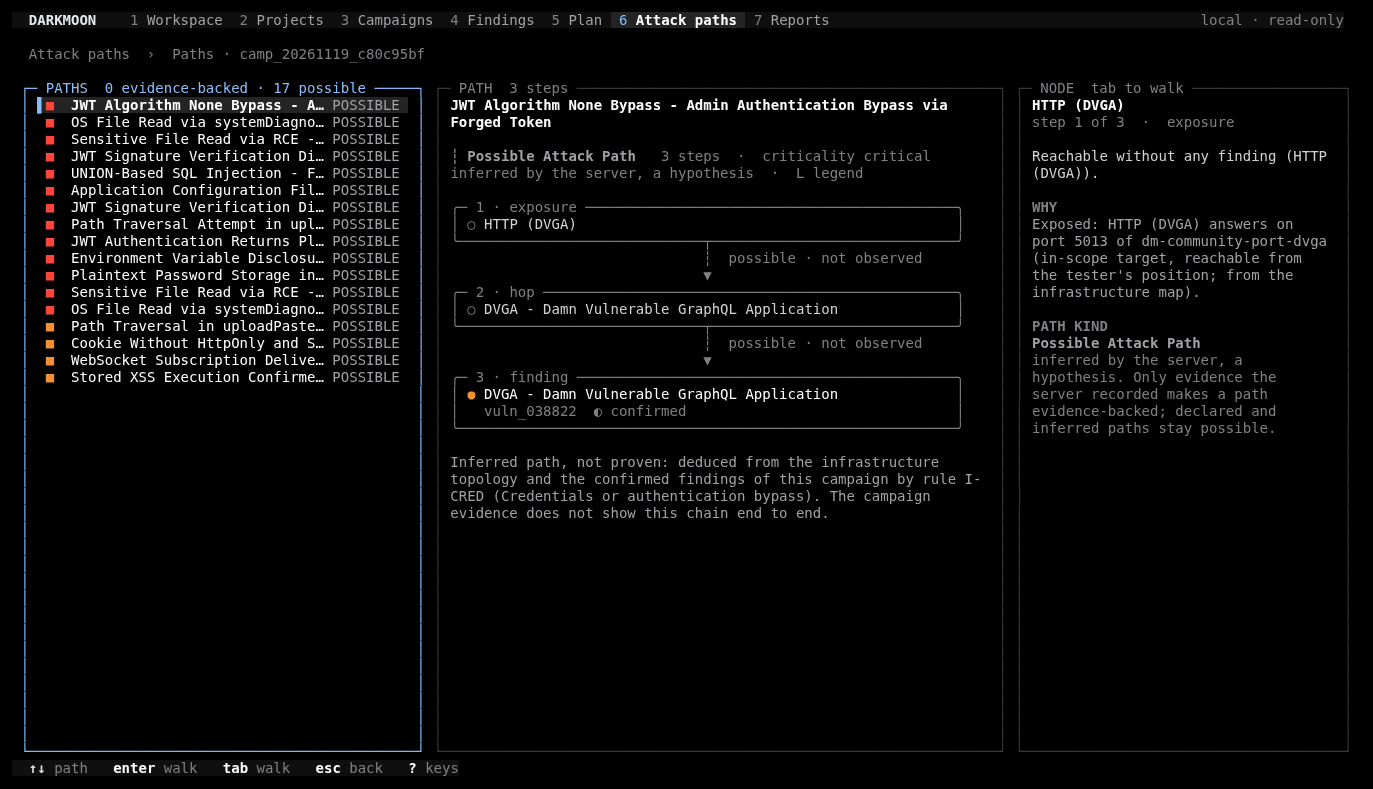
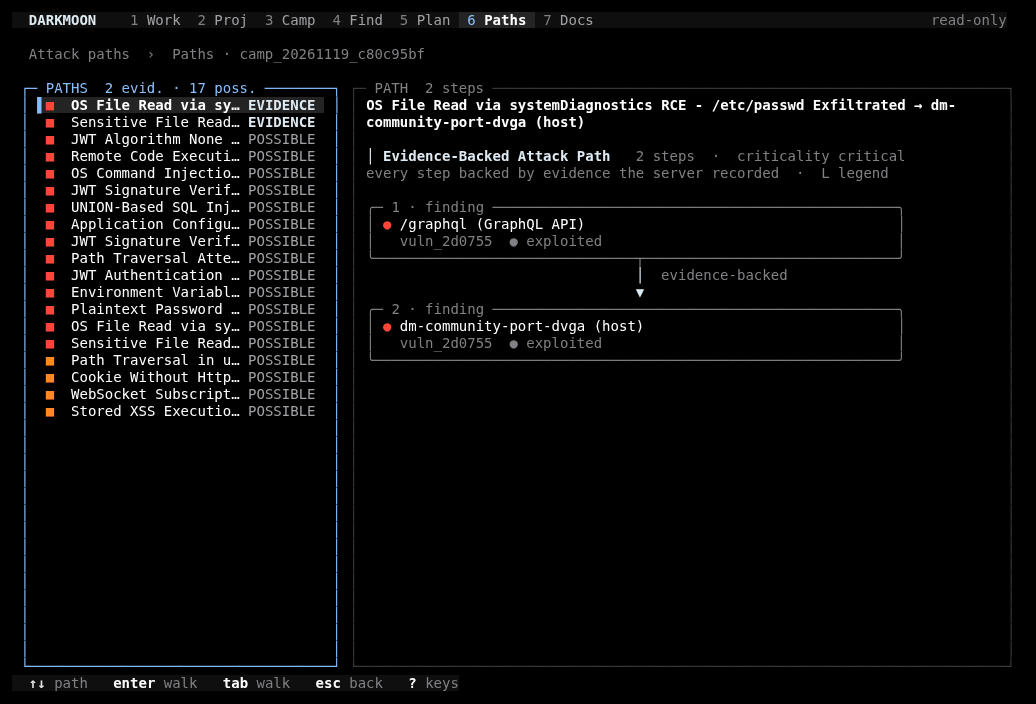
| Terminal chain | OpenTUI, vertical node cards | top → bottom | works at 80 columns, ASCII fallback | branches listed path by path, not merged |
Theory behind them
- The layered graph is the Sugiyama framework (layer assignment, crossing reduction, coordinate assignment) as implemented by the Eclipse Layout Kernel. Ordering rule: proven paths first, then criticality, then length, then id. Edge merge: one link per (from → to), drawn proven as soon as one proven path uses it.
- The Atlas and orbital views apply focus + context (Furnas' degree of interest, semantic zoom).
- The guided story applies Shneiderman's mantra: overview first, zoom and filter, then details on demand.
- Proof level follows Munzner's advice on channels: it is carried by line style, a word and an icon, never by colour alone and never by severity colour. Evidence-Backed is solid with a shield; Possible is dashed with a dashed circle; Treatment in progress is dotted with a wrench. The same words appear on the 2D map, the paths rail, the 3D legend, the report and the terminal.
Real results
The orbital map: from lab to honest instrument
- Prototype (25 to 26 September 2026). A three.js lab with three variants in one page: Minimal, Guided, Spatial. Ideas tested: concentric exposure rings, an OSI decomposition when tilting, MITRE-annotated paths, WebXR without vendor SDKs. Only the Guided variant was kept and ported; a from-scratch rebuild was rejected in favour of reusing the lab engine.
- Integration (26 September). The port shipped together with server-side finding attachment, because the earlier map's incoherence came from data, not rendering.
- Honesty hardening (October to November). The legacy "attack" mode was renamed exposure path ("inventory, not a proven attack chain"); the server's proven paths were drawn on the map; narrative that the server had not supplied was removed. Today, with proven paths the intro card offers "Trace the attack path"; without, it shows the server's note ("… This does not mean that no path exists.") and "Walk the exposure path", with every step labelled "Exposure path · not proven" and drawn dashed.
- Rendering. The three.js loop runs only while something moves (interaction, tween, damping, XR session) and stops after 2,000 ms idle; it pauses when the list view hides the map. "Enter VR" appears only if the browser reports
immersive-vrsupport. - Size. The component grew from 410 lines in early November to 805 lines at the documented commit.
The layered graph and the Atlas map
A pixel-matched node-editor "flow graph" was tried as the default map and rejected for lack of motion and depth; the recorded lesson is that "a reference is a mood for an experience, not a static image to trace". The ELK layered graph replaced it for paths, and the Atlas nested-boundary map became the 2D infrastructure view, with a floating toolbar (Overview, Standard, Detailed, Fit, Reset, Open in 3D, View in VR).
The terminal
The Terminal Explorer renders a path as a vertical chain of node cards, ─▶ for proven links and ╌▶ for hypotheses, at 80, 100 or 150 columns, with zero model calls while browsing (verified by message counts). On the same demo campaign, the Community edition shows 0 evidence-backed paths by construction, while Pro shows the 2 server-backed paths.
Limits
- No measured comparison of the layered graph, the Atlas map and the orbital map for the same task (time to locate the most exposed asset, error rate).
- No performance numbers: no ELK layout time on phones, no frame time or GPU memory for the orbital map.
- No user study of whether line style plus word is understood without training.
- The orbital map's severity colours differ from the app's severity tokens, a known inconsistency.
- Branching paths are not merged into one directed acyclic graph in the terminal and only partially in the layered graph; whether merging helps triage is untested.
- The guided story tells one proven path; behaviour with two or more proven paths was not evaluated on real data.
Figures

Scientific sources
- Sugiyama, Tagawa, Toda. Methods for Visual Understanding of Hierarchical System Structures. IEEE Trans. Systems, Man, and Cybernetics 11(2), 1981. doi:10.1109/TSMC.1981.4308636
- Eclipse Layout Kernel. ELK Layered algorithm reference. eclipse.dev
- Furnas. Generalized fisheye views. CHI '86. doi:10.1145/22339.22342
- Shneiderman. The eyes have it: a task by data type taxonomy for information visualizations. 1996. doi:10.1109/VL.1996.545307
- Munzner. Visualization Analysis and Design. 2014. doi:10.1201/b17511
- W3C. WebXR Device API. w3.org
- Lallie, Debattista, Bal. A review of attack graph and attack tree visual syntax in cyber security. Computer Science Review, 2020. doi:10.1016/j.cosrev.2019.100219 (from the attack-paths repository bibliography; the review found no consensus notation)
Research, source code & reproducibility
- Main research repository: ASCIT31/darkmoon-visualization-research, see graph layouts, orbital graph, data visualization and terminal architecture
- Sister research repository: ASCIT31/darkmoon-attack-paths-research (what Evidence-Backed and Possible mean in the engine)
- Source code (open source): ASCIT31/Dark-Moon, with the Terminal Explorer plugin. The Pro Angular views are proprietary and can be seen on demo.dark-moon.org.
- Benchmarks: visualization benchmarks and "not measured" list; detection records in ASCIT31/Darkmoon-Benchmarks
- Official documentation: docs.dark-moon.org
- Scientific references: visualization bibliography
- Reproducible experiments: successes, failures, UX decision records UXDR-02, UXDR-05, UXDR-13, screenshots with metadata
Related articles
- Redesigning a Cybersecurity Dashboard Around Attack Paths
- Declared vs Proven Attack Paths: A Practical Evidence Model
- Agent-Native Attack Graphs: Why We Let AI Agents Declare Dependencies
- Attack Graphs, Knowledge Graphs and Causal Reasoning: What Is Actually Different?
- Designing Explainable Security Graphs Without Misrepresenting Evidence
- Visualizing Attack Paths in ASCII and Unicode
The terminal views ship in DarkMoon Community and can be opened on any local campaign. A task-based comparison of these layouts is the open question we would most like help with.
See the proof, not just the write-up: the Pro remediation benchmark (fixes retested against the exploit) · how Darkmoon compares to other AI pentest tools.
← All articles